

Observations of background levels of atmospheric mercury are important to help inform modelling of land-ocean-atmosphere interactions and the role the Australian region plays in global mercury cycling. Continuous measurement of gaseous elemental mercury (GEM), which comprises 95% total atmospheric mercury, can be used to measure long term trends in mercury cycling and, in combination with other measurements, emissions from sources such as biomass burning. GEM measurements can be used to address some of the research needs identified in the review of atmospheric mercury published by Fisher and Nelson (2020).
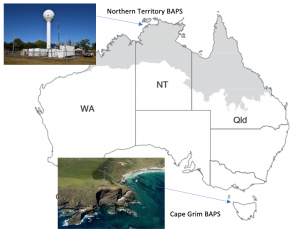
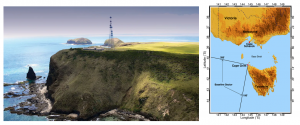
A group of researchers from CSIRO, Macquarie University (MU), University of Wollongong (UoW) and Bureau of Meteorology (BOM) are collaborating to measure gaseous elemental (GEM) mercury at two long term background monitoring sites in Australia (Figure 1). Both sites are impacted by continental and marine airmasses, providing a good indication of the range of GEM levels in the background atmosphere in Australia. Both sites are part of the World Meteorological Organisation Global Atmospheric Watch network and include additional important atmospheric observations that are useful for elucidating the sources, chemistry and sinks for mercury cycling (e.g., radon, CO2, CO, ozone and particle concentrations, wind direction, wind speed, rainfall and temperature).
The Northern Territory Baseline Air Pollution (NT BAPS) station, located in the tropical savannah region of Australia, has measured GEM measurements with a Tekran 2537X analyser since June 2014. The Cape Grim Baseline Air Pollution Station (CG BAPS), located on a bluff on the North West tip of Tasmania, has measured GEM with a Tekran 2537B analyser since September 2011 with the addition of a Tekran 2537X analyser since June 2017.
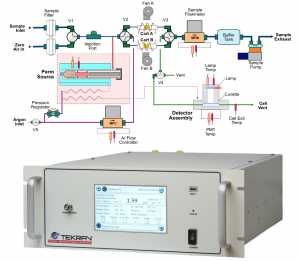
The Tekran analysers use a cold vapour atomic fluoroscopy (CVAFS) detection method to quantify GEM concentrations in air. Figure 2 is a schematic of the internal workings of the Tekran analyser. The air is passed through cartridges over a 5-minute period where it is adsorbed onto gold beads within the cartridge. The cartridge is heated and releases mercury into the CVAFS detector where the mercury mass is detected as a peak in voltage. The sample peak area is integrated and calibrated against the peak area from a known mass of mercury emitted from an internal mercury permeation source kept at a known temperature. The mass is then divided by the sample volume to report a GEM concentration.
GEM is easily lost onto surfaces so sample inlet lines are heated and composed of inert material such as Teflon. Atmospheric particles are removed by a filter and soda lime traps remove acid gases and halides that may interfere with collection of GEM onto the gold traps.
Northern Territory Baseline Air Pollution Station
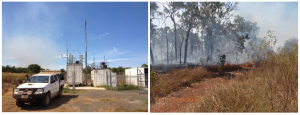
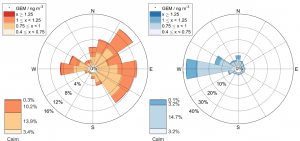
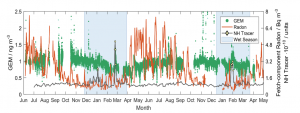
The NT BAPS is located at Gunn Point, ~30 km north east of Darwin and is < 2 km from the coast and is surrounded by tropical savannah vegetation (Figure 3). The airmasses that impact the site are highly seasonal (Figure 4). Prevailing winds in the Dry Season (Apr – Sept) bring continental airmasses from the south east, enriched in GEM from widespread savannah burning, particularly from fires towards the end of the Dry Season in October (Howard et al., 2017). Prevailing north to north-westerly winds in the Wet Season bring marine air masses from the tropical oceans. Intermittent peaks in GEM during the monsoon can occur during periods when the intertropical convergence zone brings incursions of GEM enriched airmasses from the northern hemisphere (Howard et al., 2017).
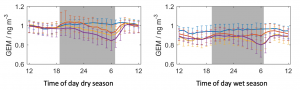
The time series of GEM between June 2014 and May 2016 (Figure 5) shows short-lived peak concentration occurring in the mid to late Dry Season, consistent with the release of mercury from soils and vegetation due to volatilisation and thermal desorption during biomass burning events (Howard et al., 2017). The diurnal patten of GEM concentrations in the wet and dry season (Figure 6) can display night-time depletion, when vertical mixing of the atmosphere is minimised so that GEM deposition to surfaces is more likely to occur. GEM concentrations rebound by about 9 am in the morning when deeper mixing starts to occur. This diurnal pattern has been observed in both Wet and Dry Seasons.
In 2014 the SAvannah FIRes in Early Dry season (SAFIRED) campaign, GEM measurements from this site were used to determine emission factors of GEM for savannah burning, particularly for scrubland vegetation (Desservettaz et al. 2017).
Cape Grim Baseline Air Pollution Station
Cape Grim is located 90 m above sea level on a bluff at the north west tip of Tasmania. Airmasses from the “baseline sector”, with a long fetch across the Southern Ocean, occur for about 35% of the year (Figure 7).
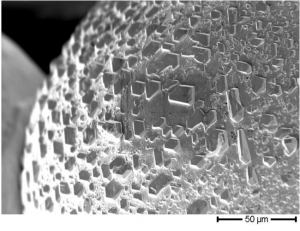
An analysis of 2011 to 2013 GEM measurements from five remote sites in the Southern Hemisphere found mean annual concentrations ranged from 0.85 to 1.05 ng m-3 Slemr et al. (2015). Cape Grim observations for 2012-2013 were lower than the other sites, leading to a review of the instrument performance. Drifts in the calibration response of each cartridge that correlated with drifts in ambient concentrations were observed. An additional Tekran, collocated in September 2013, exhibited similar drift, suggesting an environmental influence on instrument performance. Closer examination of the gold cartridges showed crystalline structures on the surface, resulting in reduced collection efficiency (Figure 8). These structures were thought to be caused by reactions with acid gases or halides in the coastal marine air. As a result, soda lime traps were added to the inlet line to minimize passivation and the trap cleaning process was improved. Correction of 2012 and 2013 data for drift from passivation increased the annual concentration from 0.85 to 0.93 ng m-3.
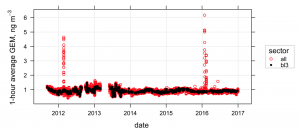
A time series of hourly average data from 2011 to 2016 (Figure 9) shows that concentrations from the baseline sector are similar to that from all sectors, except for occasional plume strikes from biomass burning events in summer 2012 and 2016. These plume strikes were used by Howard et al. (2019) to test experimentally dervied emission factors for temperate eucalypt surface fuels. They found previous emission factors overestimated emissions from dry temperate eucalypt forests in the south east region of Australia by about 60% and recommended a new EF of 28.7 ± 8.1µg Hg/kg dy fuel be used.
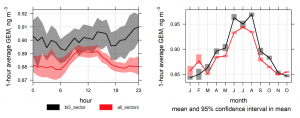
Analysis of measurements taken after the implementation of improved cartridge cleaning protocols in September 2013 shows diurnal and seasonal patterns in GEM. Daily concentrations peak in the early afternoon and are lowest just before sunrise. There is also a seasonal cycle of amplitude ~0.1 ng m-3, with GEM highest in winter, reaching a maxima in August, and a mimina in January, both in baseline and in all wind sector conditions. This seasonal pattern, also observed by Slemr in the analysis of 2011-2013 data, has been reproduced for 2013-2016 using the GEOS-Chem biogeochemical Hg model (Page 2018).
Current activities
A second, newer Tekran 2537X model analyser was installed at Cape Grim in June 2017. This newer model has greater sensitivity, less noise and response factors that are six times greater than the older Tekran B model. Comparison of mean GEM for June to December 2017 showed that on average Tekran X concentrations (1.08 ng m-3) were 15% higher than Tekran B concentrations (0.92 ng m-3) (Figure 11). This bias lead to going investigations into the calibration and performance of both instruments to determine whether agreement could be improved.
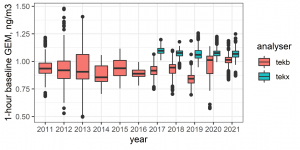
The accuracy of internal calibration masses and sample volumes of both instruments were verified using external primary standards, suggesting that the lower analyser sensitivity for Tekran B may influence quantitation of background ambient concentrations. Cleaning and replacement of some optical components, and the implementation of peak integration settings optimized for low peak areas, has increased mean concentrations from Tekran B, bringing agreement between both analysers to within 7% in 2021.
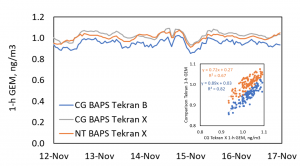
At the end of 2020, the NT BAPS Tekran X was removed from the site for major maintenance and due to COVID-imposed restrictions to site access, is not expected to be reinstalled until early 2022. We have taken this opportunity to compare the performance of the NT BAPS Tekran with the CG BAPs Tekrans by running them alongside each other at CG BAPs since 12 Nov 2021. Initial assessment of the intercomparison shows all instruments are now running well and are sensitive enough to detect small changes in concentrations at ambient levels . The two Tekran X analysers compare to within 2.5% of each other; the Tekran B analyser is lower and agrees to within 7% of both Tekran X analysers (Figure 12).
Measurements of GEM at both the NT BAPs and CG BAPS have also been used to calibrate mercury passive samplers (McLagan et al., 2018). Passive samplers offer an opportunity to increase the spatial coverage of atmospheric mercury measurement around Australia, including in remote locations where power is not available. While the sample period for passive sampler measurements is coarser (3 months), if deployed for several years they will provide valuable data to assess trends in mercury concentrations. We are currently working with Environment and Climate Change Canada towards establishing passive sampling at four sites in Australia in NSW, WA, Queensland and Darwin in 2022.
Establishing a long term dataset for GEM at numerous sites around Australia is needed to understand changes in GEM concentrations in the atmosphere and will be an important metric to assess the effectiveness of global efforts to reduce anthropogenic emissions of mercury under the Minamata Convention.
By Ms Jennifer Powell and Dr Melita Keywood – Commonwealth Scientific and Industrial Research Organisation (CSIRO), Oceans and Atmosphere.
Past and present collaborators
Macquarie university: Peter Nelson, Tony Morrison, Grant Edwards, Dean Howard, Matthieu Miller
University of Wollongong: Jenny Fisher, Clare Murphy, Max Desservettaz
CSIRO: Melita Keywood, Rob Gillett, Jenny Powell, Jason Ward, James Harnwell, Erin Dunne, Jon Schatz
BOM: Sam Cleland, Nigel Somerville, Jeremy Ward, Cindy Spinks, Stuart Baly, Brad Atkinson
References
Desservettaz, M., et al. (2017), Emission factors of trace gases and particles from tropical savanna fires in Australia, J. Geophys. Res. Atmos., 122, 6059– 6074, doi:10.1002/2016JD025925.
Fisher, JA and Nelson, PF. 2020. Atmospheric mercury in Australia: Recent findings and future research needs. Elem Sci Anth, 8: 1. DOI: https://doi.org/10.1525/elementa.2020.070
Howard, D., Nelson, P. F., Edwards, G. C., Morrison, A. L., Fisher, J. A., Ward, J., Harnwell, J., van der Schoot, M., Atkinson, B., Chambers, S. D., Griffiths, A. D., Werczynski, S., and Williams, A. G.: Atmospheric mercury in the Southern Hemisphere tropics: seasonal and diurnal variations and influence of inter-hemispheric transport, (2017) Atmos. Chem. Phys., 17, 11623–11636, https://doi.org/10.5194/acp-17-11623-2017, 2017.
Howard, D., Macsween, K., Edwards, G. C., Desservettaz, M., Guérette, E.-A., Paton-Walsh, C., … (Mick) Meyer, C. P. (2019). Investigation of mercury emissions from burning of Australian eucalypt forest surface fuels using a combustion wind tunnel and field observations. Atmospheric Environment, 202, 17–27. doi:10.1016/j.atmosenv.2018.12.015
McLagan, D. S., Mitchell, C. P. J., Steffen, A., Hung, H., Shin, C., Stupple, G. W., Olson, M. L., Luke, W. T., Kelley, P., Howard, D., Edwards, G. C., Nelson, P. F., Xiao, H., Sheu, G.-R., Dreyer, A., Huang, H., Abdul Hussain, B., Lei, Y. D., Tavshunsky, I., and Wania, F.: Global evaluation and calibration of a passive air sampler for gaseous mercury, Atmos. Chem. Phys., 18, 2018, 5905–5919, https://doi.org/10.5194/acp-18-5905-2018, 2018.
Oliveira Sofia L. J., Maier Stefan W., Pereira José M. C., Russell-Smith Jeremy (2015) Seasonal differences in fire activity and intensity in tropical savannas of northern Australia using satellite measurements of fire radiative power. International Journal of Wildland Fire 24, 249-260. https://doi.org/10.1071/WF13201
Page, Neil Christopher, Using observations and modelling to quantify mercury biogeochemical cycling in the Australian context, Master of Research thesis, School of Earth and Environmental Science, University of Wollongong, 2017. https://ro.uow.edu.au/theses1/239
Slemr, F., Angot, H., Dommergue, A., Magand, O., Barret, M., Weigelt, A., Ebinghaus, R., Brunke, E.-G., Pfaffhuber, K. A., Edwards, G., Howard, D., Powell, J., Keywood, M., and Wang, F.: Comparison of mercury concentrations measured at several sites in the Southern Hemisphere, Atmos. Chem. Phys., 15, 2015, 3125–3133, https://doi.org/10.5194/acp-15-3125-2015, 2015.
Twitter